Introduction
In the summer of 2024 during a Camb-Hams trip to Friedrichshafen, I was drawn into the world of SOTA (summits on the air). A key requirement for SOTA activations is a compact, lightweight and effective station.
When I got started, I was able to use Rob M0VFC‘s Elecraft KX2 portable transceiver. However, from our third SOTA activation of the holiday I was taking my own Icom IC-705. My CW is not great, and so I was activating on SSB mainly on HF (and some FM on VHF/UHF). The IC-705 was a little easier than the internal microphone on the KX2. Rob M0VFC was kind enough to loan me use of his 3S LiPo battery, but I noted that as soon as the voltage dropped a little from full (4.2V * 3S = 12.6V), the IC-705 power was reduced considerably. This was also apparent on the KX2, but isn’t usually an issue because the SOTA pro’s use CW. Anyway, a challenge to know what I needed to do was born… I needed to understand how the IC-705’s RF output power changed as a function to the DC input voltage. I set up a simple test…
The radio specification states 13.8V ± 15%, which gives us an absolute voltage range of 11.73V (13.8V-15%) to 15.87V (13.8V+15%).
Setup & Method
The test setup was simple. My IC-705 connected to a high quality lab power-supply (Rigol DP821), accurate voltage and current readings for DC input power (two Keysight 34401A multi-meters) and a way to measure RF output power (Keysight N9010B spectrum analyser & 30dB attenuator).
The input voltage and current could be measured and adjusted in real time and the input power would be calculated for each test. The RF output power was measured at the frequency of interest.
During all testing the external battery was removed from the radio so that the battery charging current did not confuse measurement. To generate RF, the radio was set into RTTY mode at 100% power (thus creating a pure tone at full power). Each test was automated, and tested quickly to avoid heating issues in the PA.
Initial Results
I measured things at both ends of HF (160m and 10m), and on 6m, 2m and 70cm. The results were consistent with the drop of output power I had noted. More importantly for the initial results, I could see that the behaviour was consistent across all bands, so I could concentrate testing on a single band, and take more detailed steps without creating extra work.
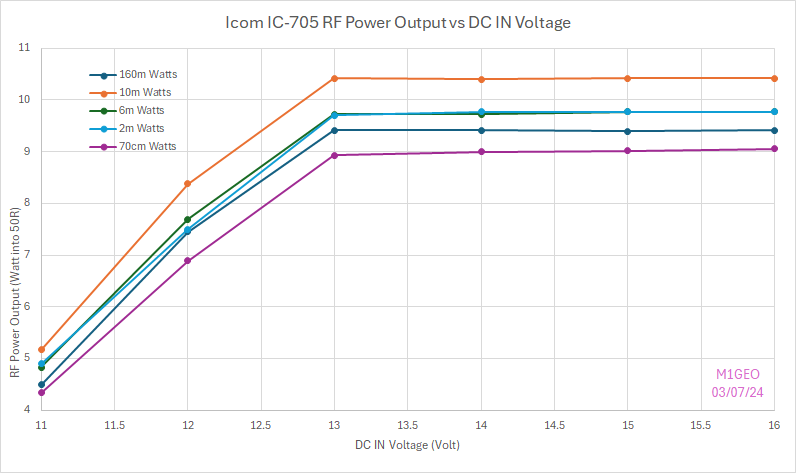
In every test, the power above 13V was very consistent, likely due to ALC on the PA. The efficiency slowly dropped as the input voltage increased. Below 13V, the power was observed to fall.
Further Testing
After the initial testing, I started digging a bit more into what happens between 11 and 13 Volts input. Working downwards from 13V there is a clear linear drop-off until around 11.8V where the software senses the falling voltage and drops to the 5W mode. At 11.6V the radio alternates between the 5W battery limit and the higher power (about 7.5W). This 11.73V threshold that the specification mentions (13.8V-15%).
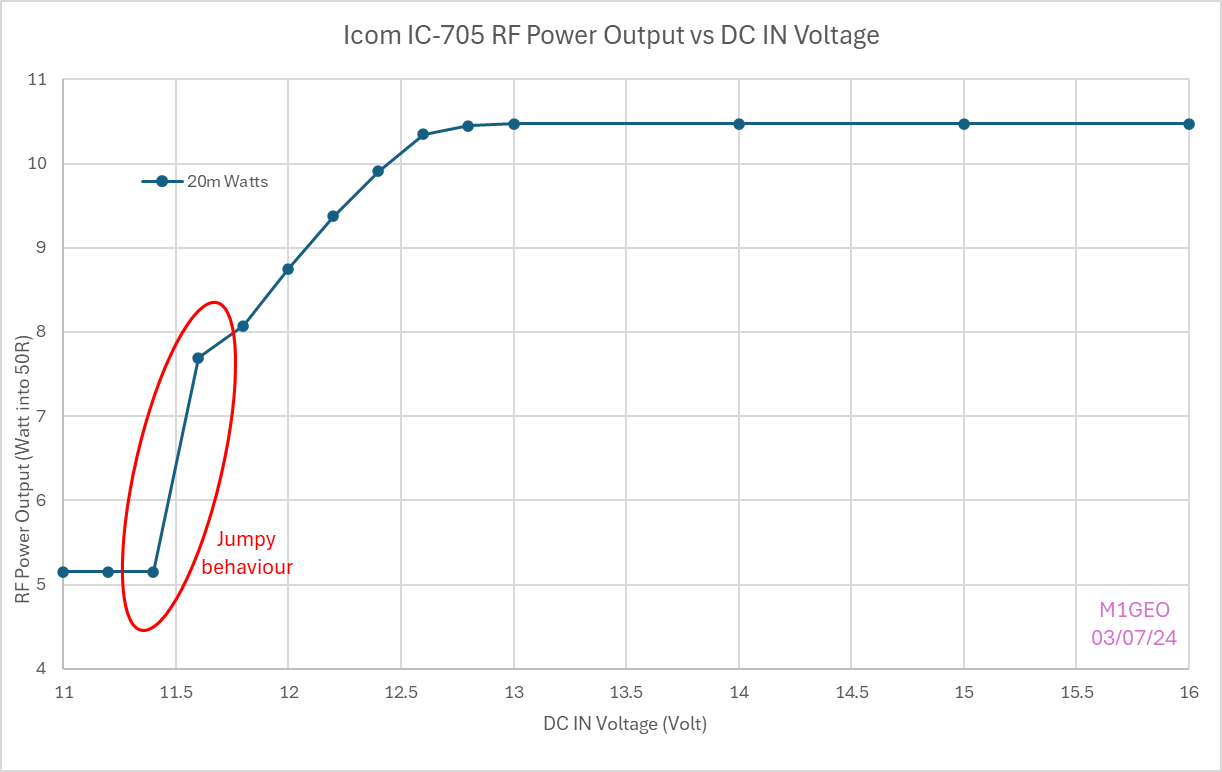
For useful purposes, we need to keep the DC IN voltage above 11.8V (and below the maximum of 15.87V).
Battery Choices
Assuming we want to keep with a modern battery technology (so, excluding NiCd and NiMH), we have two obvious choices of lithium-ion battery:
- Lithium Polymer (LiPo) battery
- Lithium Iron Phosphate (LiFePO4) battery
For each battery pack, there are different combinations of series (S) and parallel (P) configurations, detailed using this “S” and “P” notation. For example, you may see a “3S4P”, referring to three series sets of four parallel batteries. Parallel-ing the batteries increases current handling and overall power, and the voltage is unchanged. Series-ing the batteries increases the voltage and overall power, but the current is unchanged.
Each battery technology has a different nominal voltage (the assumed cell voltage), charged voltage (the maximum cell voltage) and the discharge voltage (the minimum cell voltage). A battery will often have a BMS (battery management system) to take care of protecting the battery from over-charging, over-discharging, balancing (keeping the voltage across series cells equal), etc., but these are out of scope for this page.
LiPo
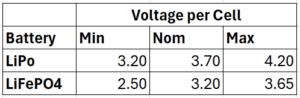
Typical Lithium Polymer (LiPo) cells have a nominal voltage of 3.7V. Fully charged, each cell is 4.2V. Fully discharged, each cell is 3.2V.
See more on LiPo cells on Wikipedia.
LiFePO4
Typical Lithium Iron Phosphate (LFP, or more commonly LiFePO4) batteries have a nominal voltage of 3.2V. Fully charged, each cell is 3.65V. Fully discharged, each cell is 2.5V.
They have a higher cycle rating than standard LiPo batteries, meaning they can be charged and discharged more many more (>60% more) times before they start to fail.
See more on LiFePO4 cells on Wikipedia.
Why not use X?
I have tried to limit my choice to batteries that are widely known and in production. I have seen AliExpress selling Sodium-Ion batteries and other similarly novel battery technologies, but without easy access and known reliability, I didn’t include them.
See more experimental battery types on Wikipedia.
Battery Comparison
From the IC-705 testing and the specification as well our two battery choices, we can see what options are available.
Extrapolating from the two battery types above, we can see that configurations in the right kind of area are as follows:
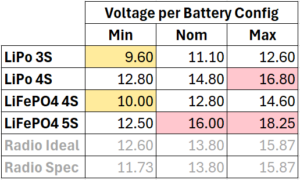
Unfortunately, there is no ideal solution with these battery technologies. It is kind of disappointing that Icom did not consider this when designing the radio – a small design tweak to take 17V would have allowed LiPo 4S battery packs to be used. Instead, the best option is LiFePO4 4S. However, as the battery discharges, the lower voltage becomes an issue.
From the tables above it is possible to see that the only real options are LiPo 3S and LiFePO4 4S since the other combinations have the ability to supply excessive voltage (>15.87V) to the radio. Of these two, the LiFePO4 4S has a higher maximum voltage (14.6V vs LiPo 3S at 12.6V). For this reason, the LiFePO4 4S is my preferred choice. LiFePO4 has the added advantage of a higher cycle count and increased safety too, so those are further marks on the LiFePO4 scorecard.
The voltage decision is made: LiFePO4 4S. Now for the capacity of the battery…
Battery Capacity
The 4S battery fixes the pack voltage to a nominal 12.8V. For the capacity, it’s just a case of estimating how much current the radio will draw and then using this to infer the battery capacity you require in “Amp-Hours”.
The IC-705 draws around 220mA (0.22A) in receive from the external power supply at 12.8V (our nominal LiFePO4 4S voltage). If we would like the radio to run on receive for an evening, say 6 hours, we’d need a battery to run 0.22A * 6h = 1.32Ah.
In reality a SOTA activation will be around 50% transmit (at ~2.1A) and 50% receive (at ~0.22A). However, the activation will probably be quite short, perhaps 30 minutes, perhaps 2 hours. By working out the average current used during an hour, an approximate runtime can be calculated for any battery or a battery capacity specified for a given desired operating period.
The final, and perhaps most important consideration for battery capacity is weight! The typical way to expand the current capability of the battery is to parallelise cells; which in effect means doubling the number of them – in our case, doubling or 4-series-connected cells, thus creating two interconnected strings of 4 cells, totalling 8 cells. This becomes a 4S2P battery pack as we discussed earlier. The capacity is doubled. But, so is the weight!
So, what did I buy?
In the end I bought a LiFePO4 4S1P battery made from 3Ah cells. This gives me a 12.8V nominal, 3Ah battery which will run the IC-705 on receive for around 13 hours, or a mix of SSB TX and receive for around 4 hours.
Feeling Brave? Try a LiPo 4S?
Shortly after writing this, I was on a discussion online and someone told me that they had run their IC-705 on a 4S LiPo pack for years and the radio had been fine. They mentioned that it stops charging the battery when the input voltage was above 16V (already out of spec) but that they had happily used 16.8V inputs (actually in excess of 17V) with no damage to the radio.
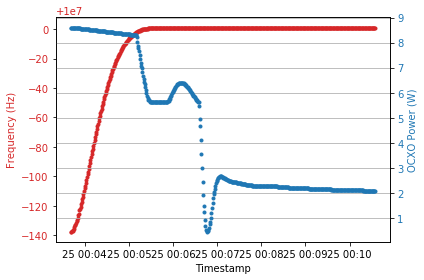
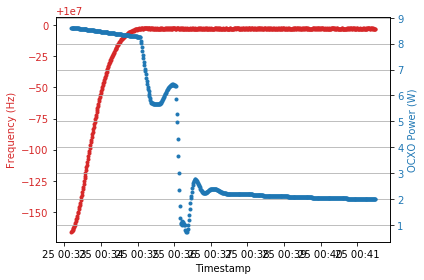
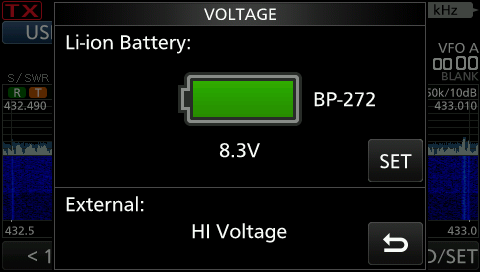
In a moment of madness, I tried 17V input and noted that (a) the IC-705 does stop charging the internal battery, (b) the HF noise floor was quieter (likely due to the battery charger powering off) and (c) that the radio didn’t explode and still delivered 10W. The radio’s voltage readout caps at 16V on the meter display and the voltage quick menu shows “Hi Voltage” instead of a number. See the two images below showing the difference at 16.9V input (from my 4S LiPo pack).
Maybe not the best thing to do long term, but it could help get you that that much needed QSO on a wet and windy SOTA…