
This silly project stemmed from an idea I had a few years back. I have thought about it for a while now, and then a few days back I decided to give it a go.
I wanted to see if I could use a soldering iron as a tool for measuring the relative temperature in a room. Knowing that the 24v AC Weller iron I have has a simple bi-metallic thermostat, I guessed that I could use the duty cycle of the heater as a means to measure the temperature. I put a small (1 ) resistor in-line with the soldering iron heater element, causing around 800 mV drop when the heater was powered, and 0 V drop when the heater was off.
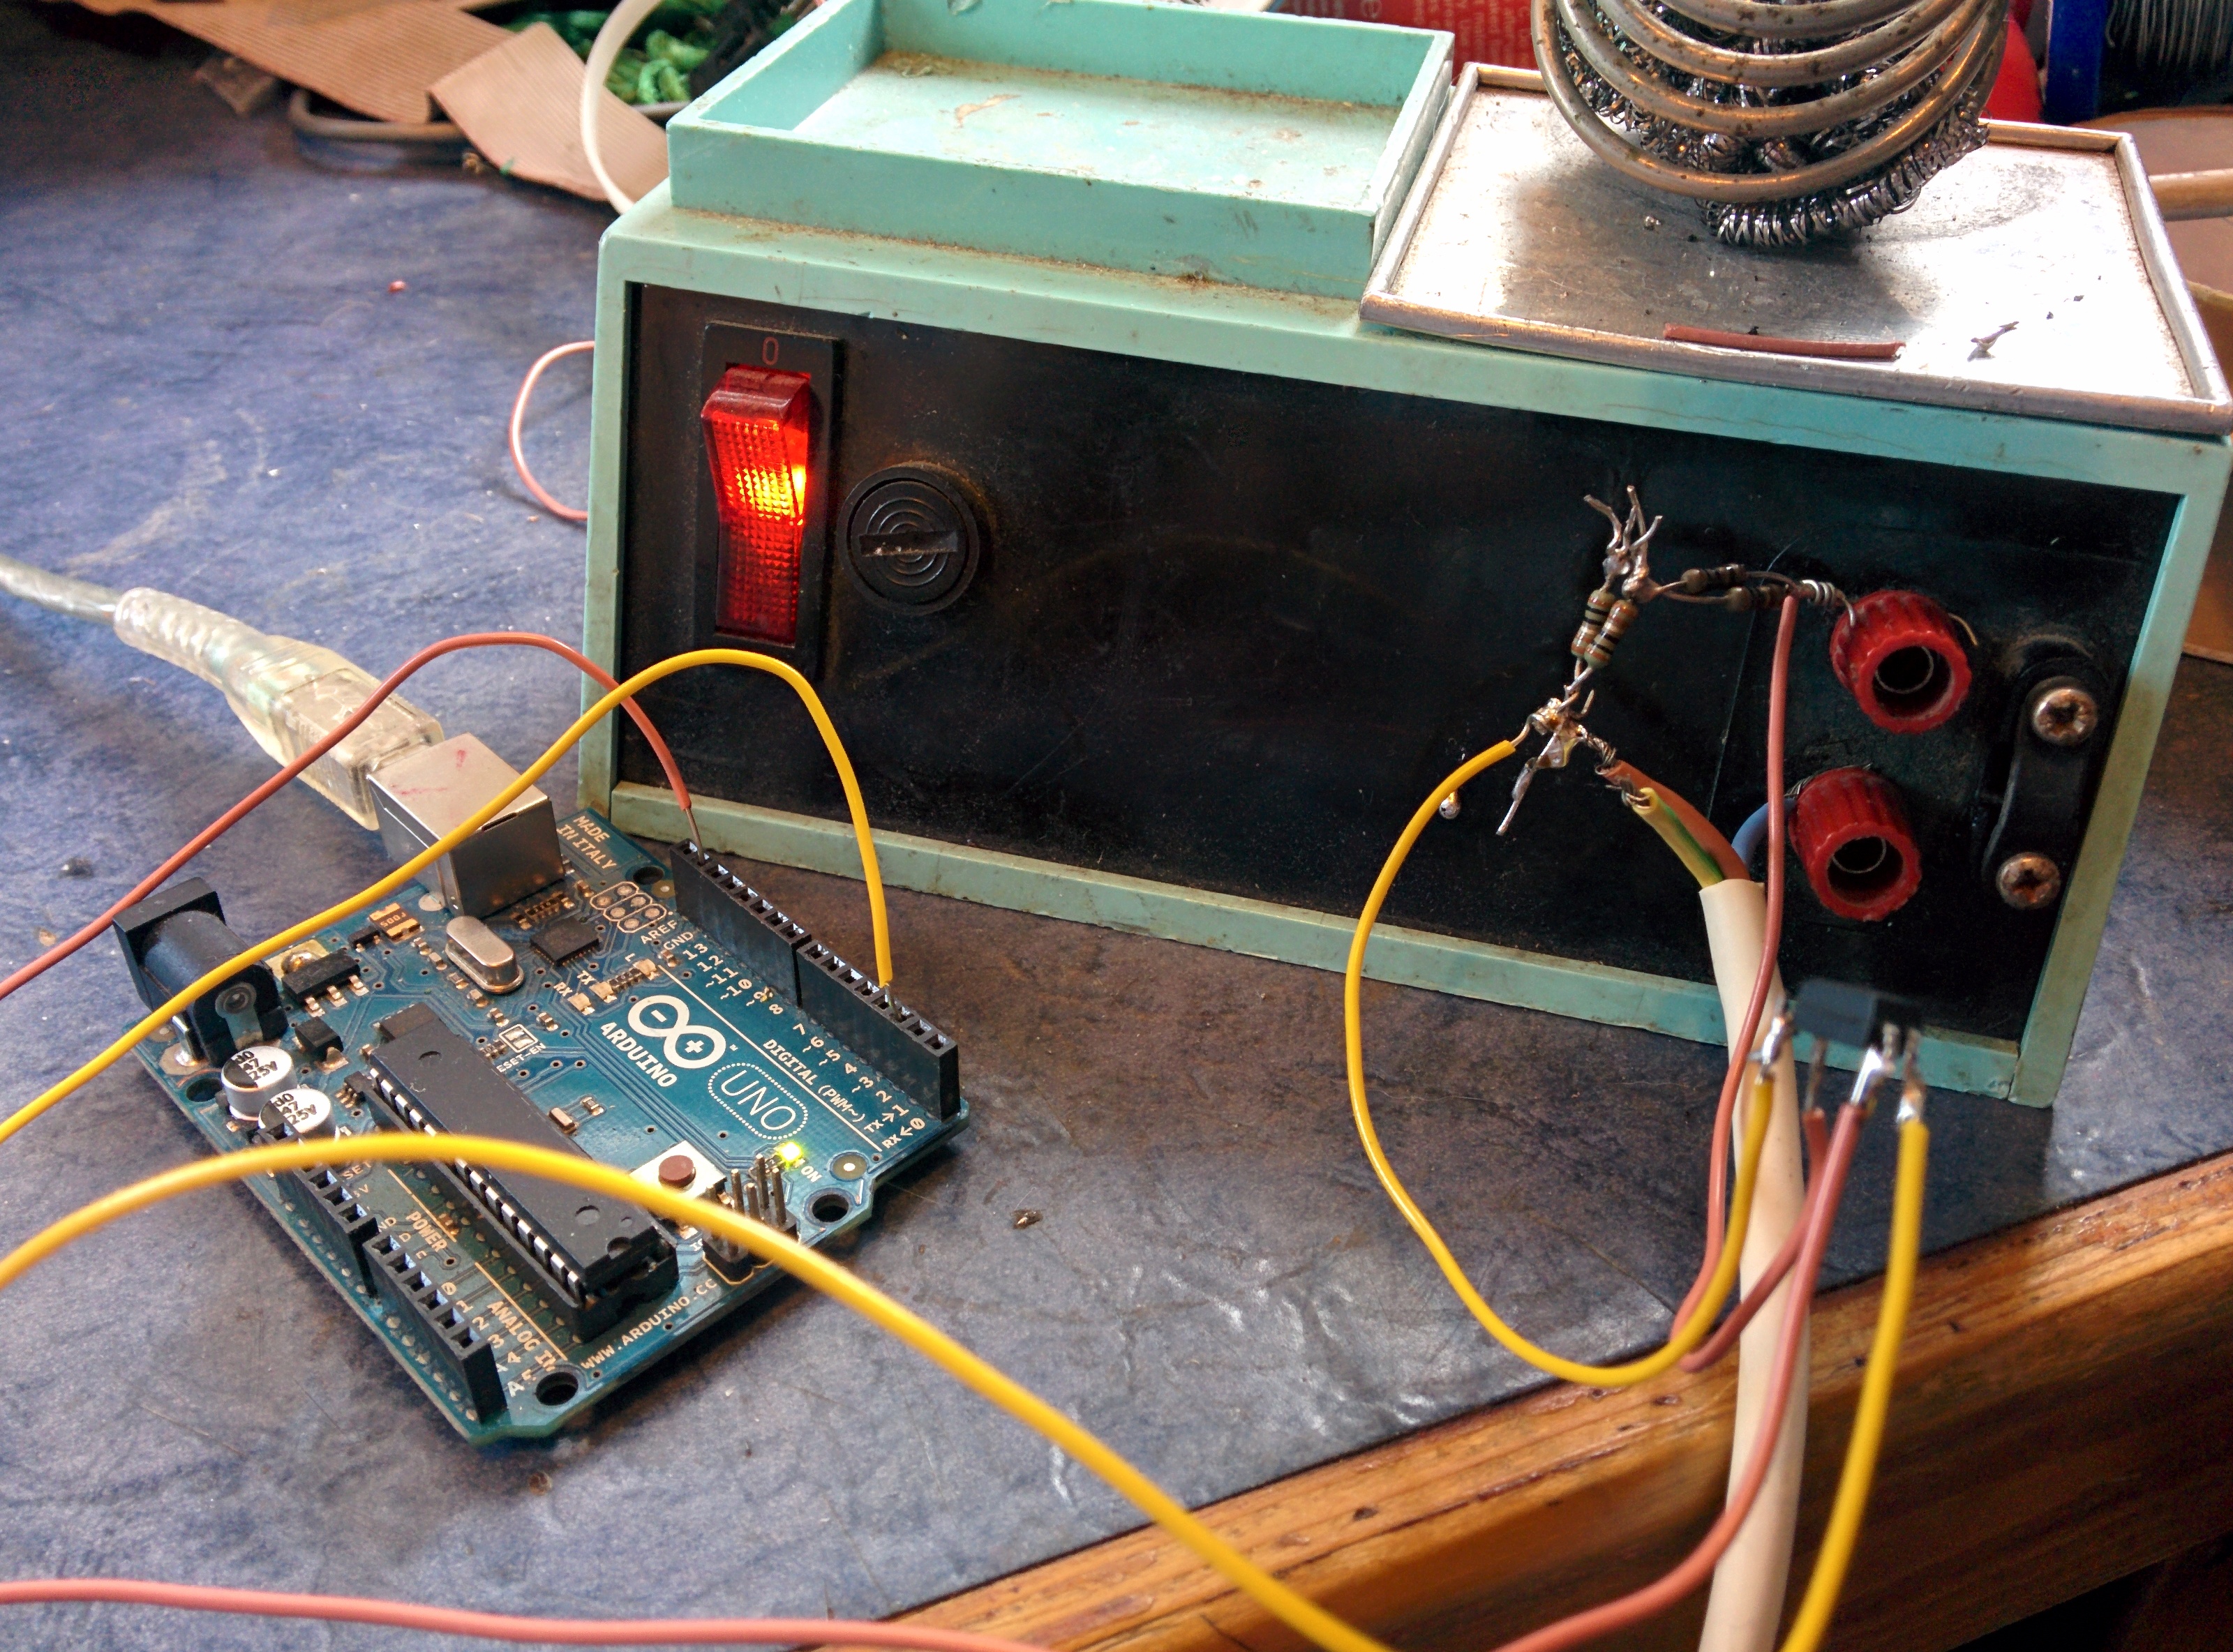
Using an opto-coupler powered from this voltage drop, I was able to feed a signal into the Arduino to display if the heater was on or not. This was a little more complex due to the system being AC powered. Instead of a nice clean TTL pulse train, I received a series of fast pulses (50Hz) since the heater is AC powered. This made the Arduino code a little tricky to write, but essentially is just a few more lines to detect the type of pulse received and then send an RS232 packet on each change of heater state.
void setup() {
//start serial connection
Serial.begin(115200);
//configure pin2 as an input and enable the internal pull-up resistor
pinMode(2, INPUT_PULLUP);
pinMode(13, OUTPUT);
Serial.println(“Iron Experiment – George Smart M1GEO”);
}int sensorVal = 0;
int heater = 0;
int heaterOld = 0;unsigned long timeStart = 0;
unsigned long timeStop = 0;void loop() {
// Wait for a 1
while (digitalRead(2) == LOW);// Wait until 0.75 period
delay(15);heaterOld = heater;
// Read pin to see if we’ve changed state
if (digitalRead(2) == LOW) {
heater = 1; //change of state indicates AC and thus heater on
} else {
heater = 0; //no change tells us heater off this poll
}if (heaterOld != heater) { // if the heater state has changed since the last test, then report it!
digitalWrite(13, heater);
Serial.print(millis());
Serial.print(“,”);
Serial.println(heater);
}
}
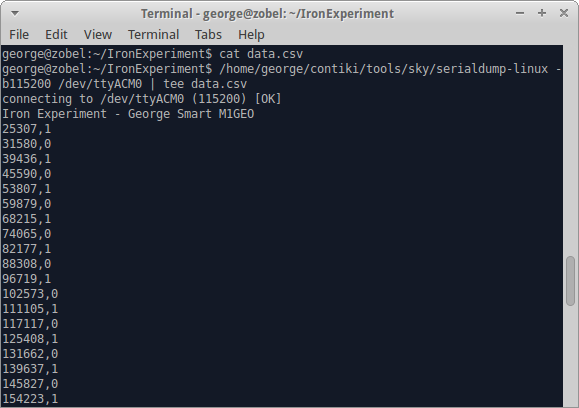
Once running, the Arduino outputs truples of data, in the form {timestamp,heater}, for example {4312,0}. These timestamps can be used to calculate the heater duty cycle. Below is a screenshot of the PC receiving the Arduino output. This text is also dumped to a CSV file.
Once finished, I used a simple MATLAB script to take the data, and work out the duty cycle of the heater. I.e the ratio of time the heater spends powered. This is done by looking for the heater on states in the captured data, and then looking for the heater off (giving the time the heater is on for) and the time until the heater next returns on (giving the total period between heating powers). From the ratio of these two, we get a duty cucle for the heater.
% Iron Experiment – George Smart M1GEO
rawdata = load(‘data.csv’);
samples = length(rawdata);
dutydata = smpldata = [;for n = 1:1:(samples-2)
if (rawdata(n,2) == 1)
a = rawdata(n,1);
b = rawdata(n+1,1);
c = rawdata(n+2,1);
period = c-a;
heater = b-a;
duty = (heater/period)*100;
smpl = a;
dutydata = duty;
smpldata = smpl;
end
end% plot results
figure(1);
hold on;
plot((smpldata/1000)/3600, 100-dutydata, ‘Color’, 0.75, 0.75) % raw data
plot((smpldata/1000)/3600, smooth(100-dutydata,100),’k’) % smoothed data
legend(‘Raw’, ‘Smoothed’)
title(‘Relative Temperature measured by Soldering Iron Heater Energy’)
xlabel(‘Experiment Time / Hours since Midnight on Day 1’)
ylabel(‘Inverse Heater Duty Cycle / Percent’)
hold off;
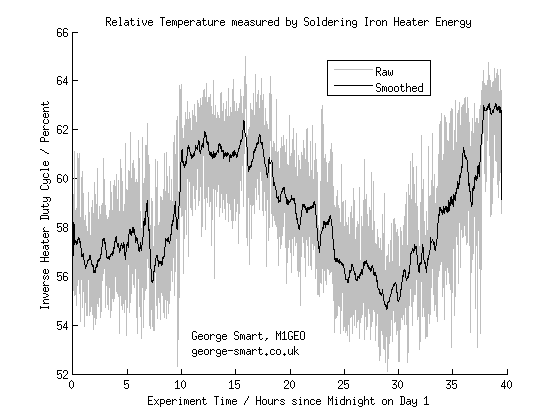
This code outputs the graph you see below. The grey is the raw data, plotted as the inverse of the duty cycle, since the hotter the room, the lower the required duty cycle. The black line plots the smoothed (100 sample moving average) data.
The next step is collate this data with actual temperature data over the same period. I expect a Dallas-Maxim DS18B20 1-wire sensor could also be attached to the Arduino, to take temperature samples when the Iron is operating.
Attempt 2
So after more than a year later, I am updating this page. I bought a new Xytronic 168-3CD soldering station, and decided that I would re-try the experiment with (a) a better controlled soldering station and (b) measuring the temperature data. I used some fans to even out the air temperature in a spare house room and had the small windows open for a week.
The new soldering iron had a heater LED, so I used that with an LDR to provide a signal into the Arduino. The code used is the same as before, since the LDR provided more than 2Mresistance in the dark, and around 3k with the heater LED on – this was enough to provide a digital signal at the Arduino IO, without touching the new iron station. A air temperature sensor was fitted on the Arduino, with code added to sample and report that too.
The code worked great, and we collected the following graphs
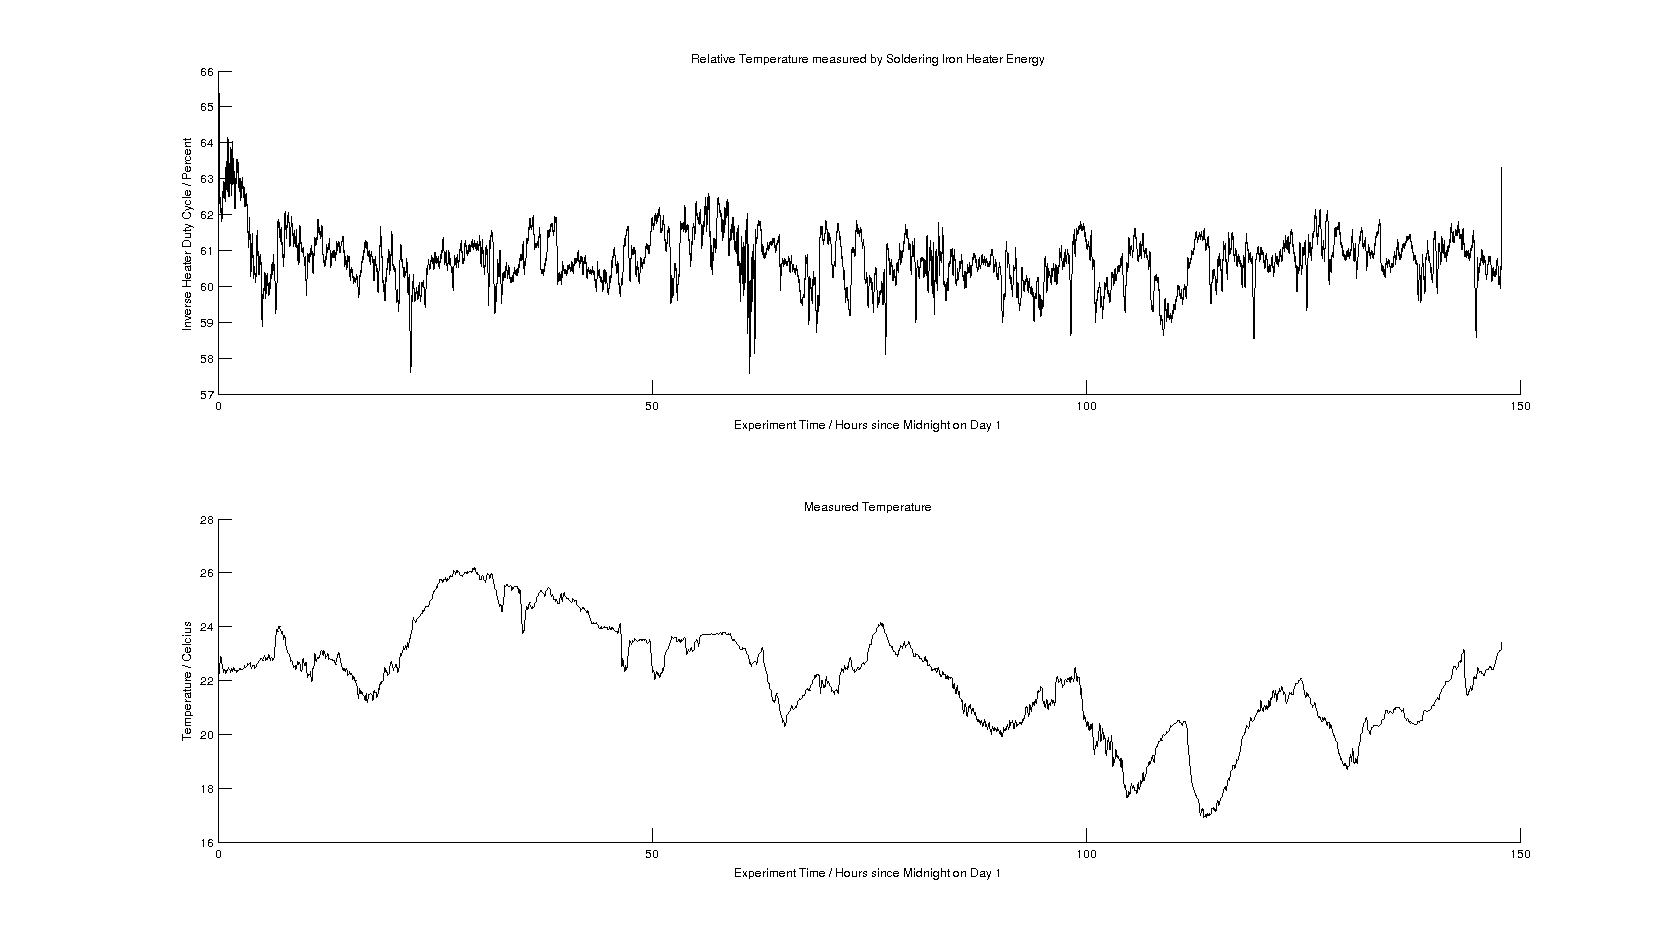
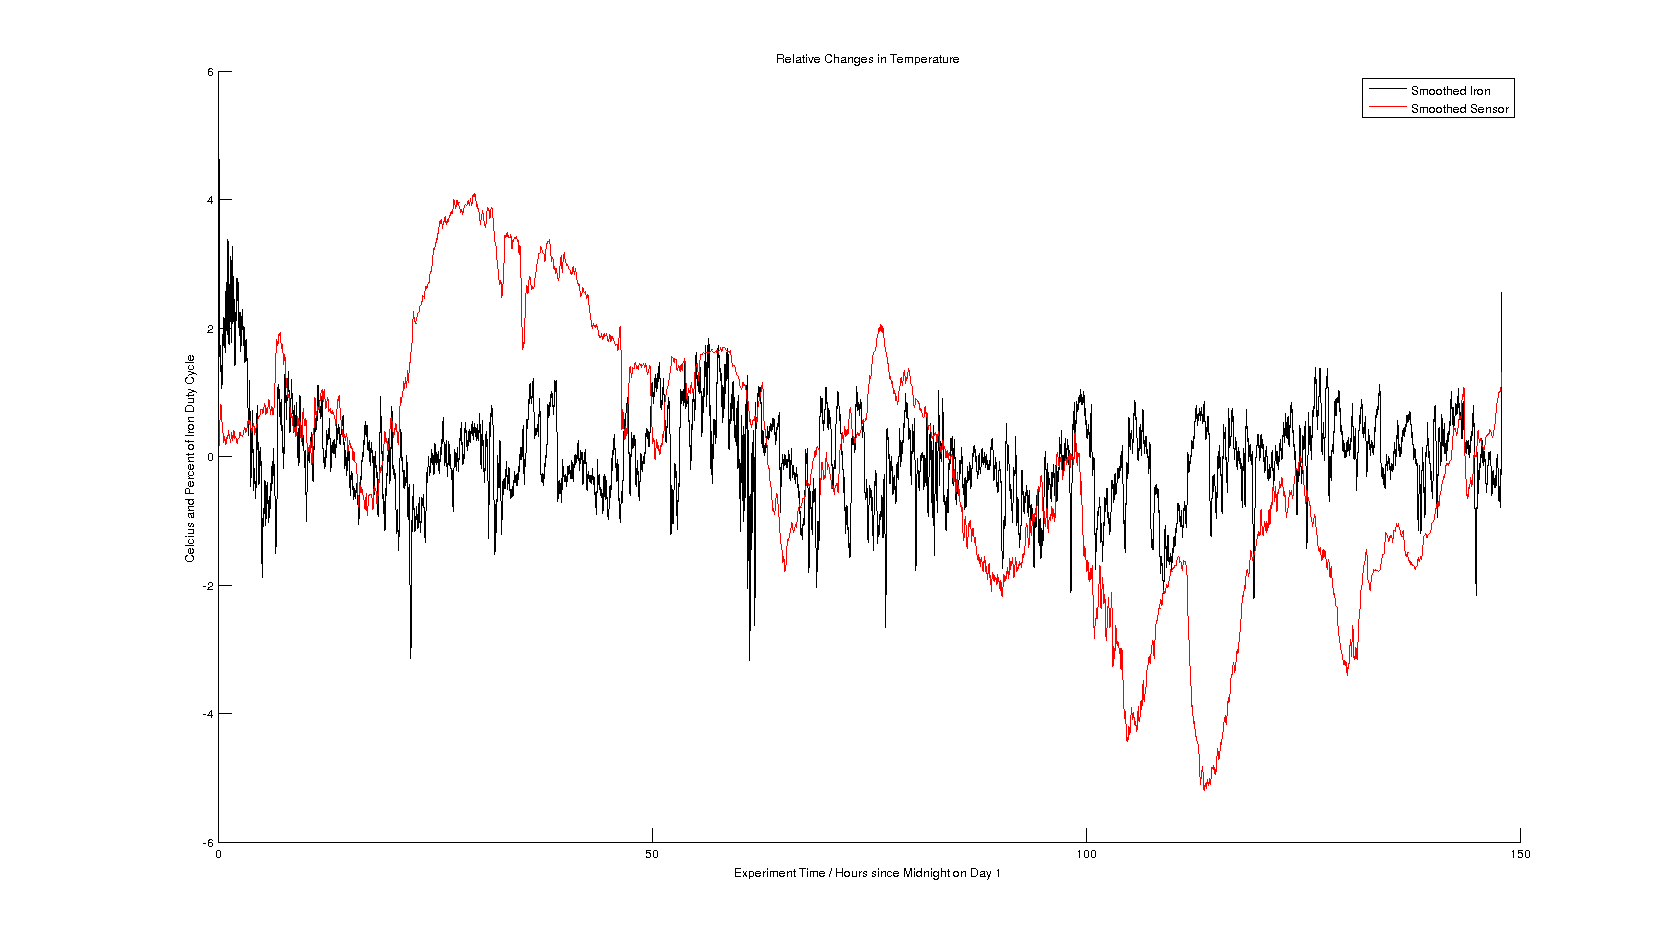
As you can see, the graphs don’t really show much correlation between temperature and iron heater duty cycle. The next attempt will be to try the setup in an outside store, and log to SD card for a few days…