Much of the work I do as part of my PhD involves me working with wireless sensor network devices. These devices transmit and receive data primarily in the 2.4 GHz ISM band, which is shared with (amongst other things) Wireless LAN and Bluetooth.
These services cause considerable problem with developing protocols for use with wireless sensor networks, which often rely on low packet loss, low electrical noise and good timing constraints. In WiFi rich environments, such as my office, much of the WSN traffic is lost due to collisions with other services.
This page documents a very small experiment to show which ZigBee IEEE 802.15.4e channels provide the best environment. I use a metric called the packet delivery ratio (PDR) similar to that described IEEE802.15.4e here to measure the ratio of packets received to those sent on a specific channel.
Two TelosB nodes are used which employ the TI/Chipcon CC2420 RF simplex transceiver. The nodes were powered by mains electricity to eliminate the possibility of battery discharge effecting results.
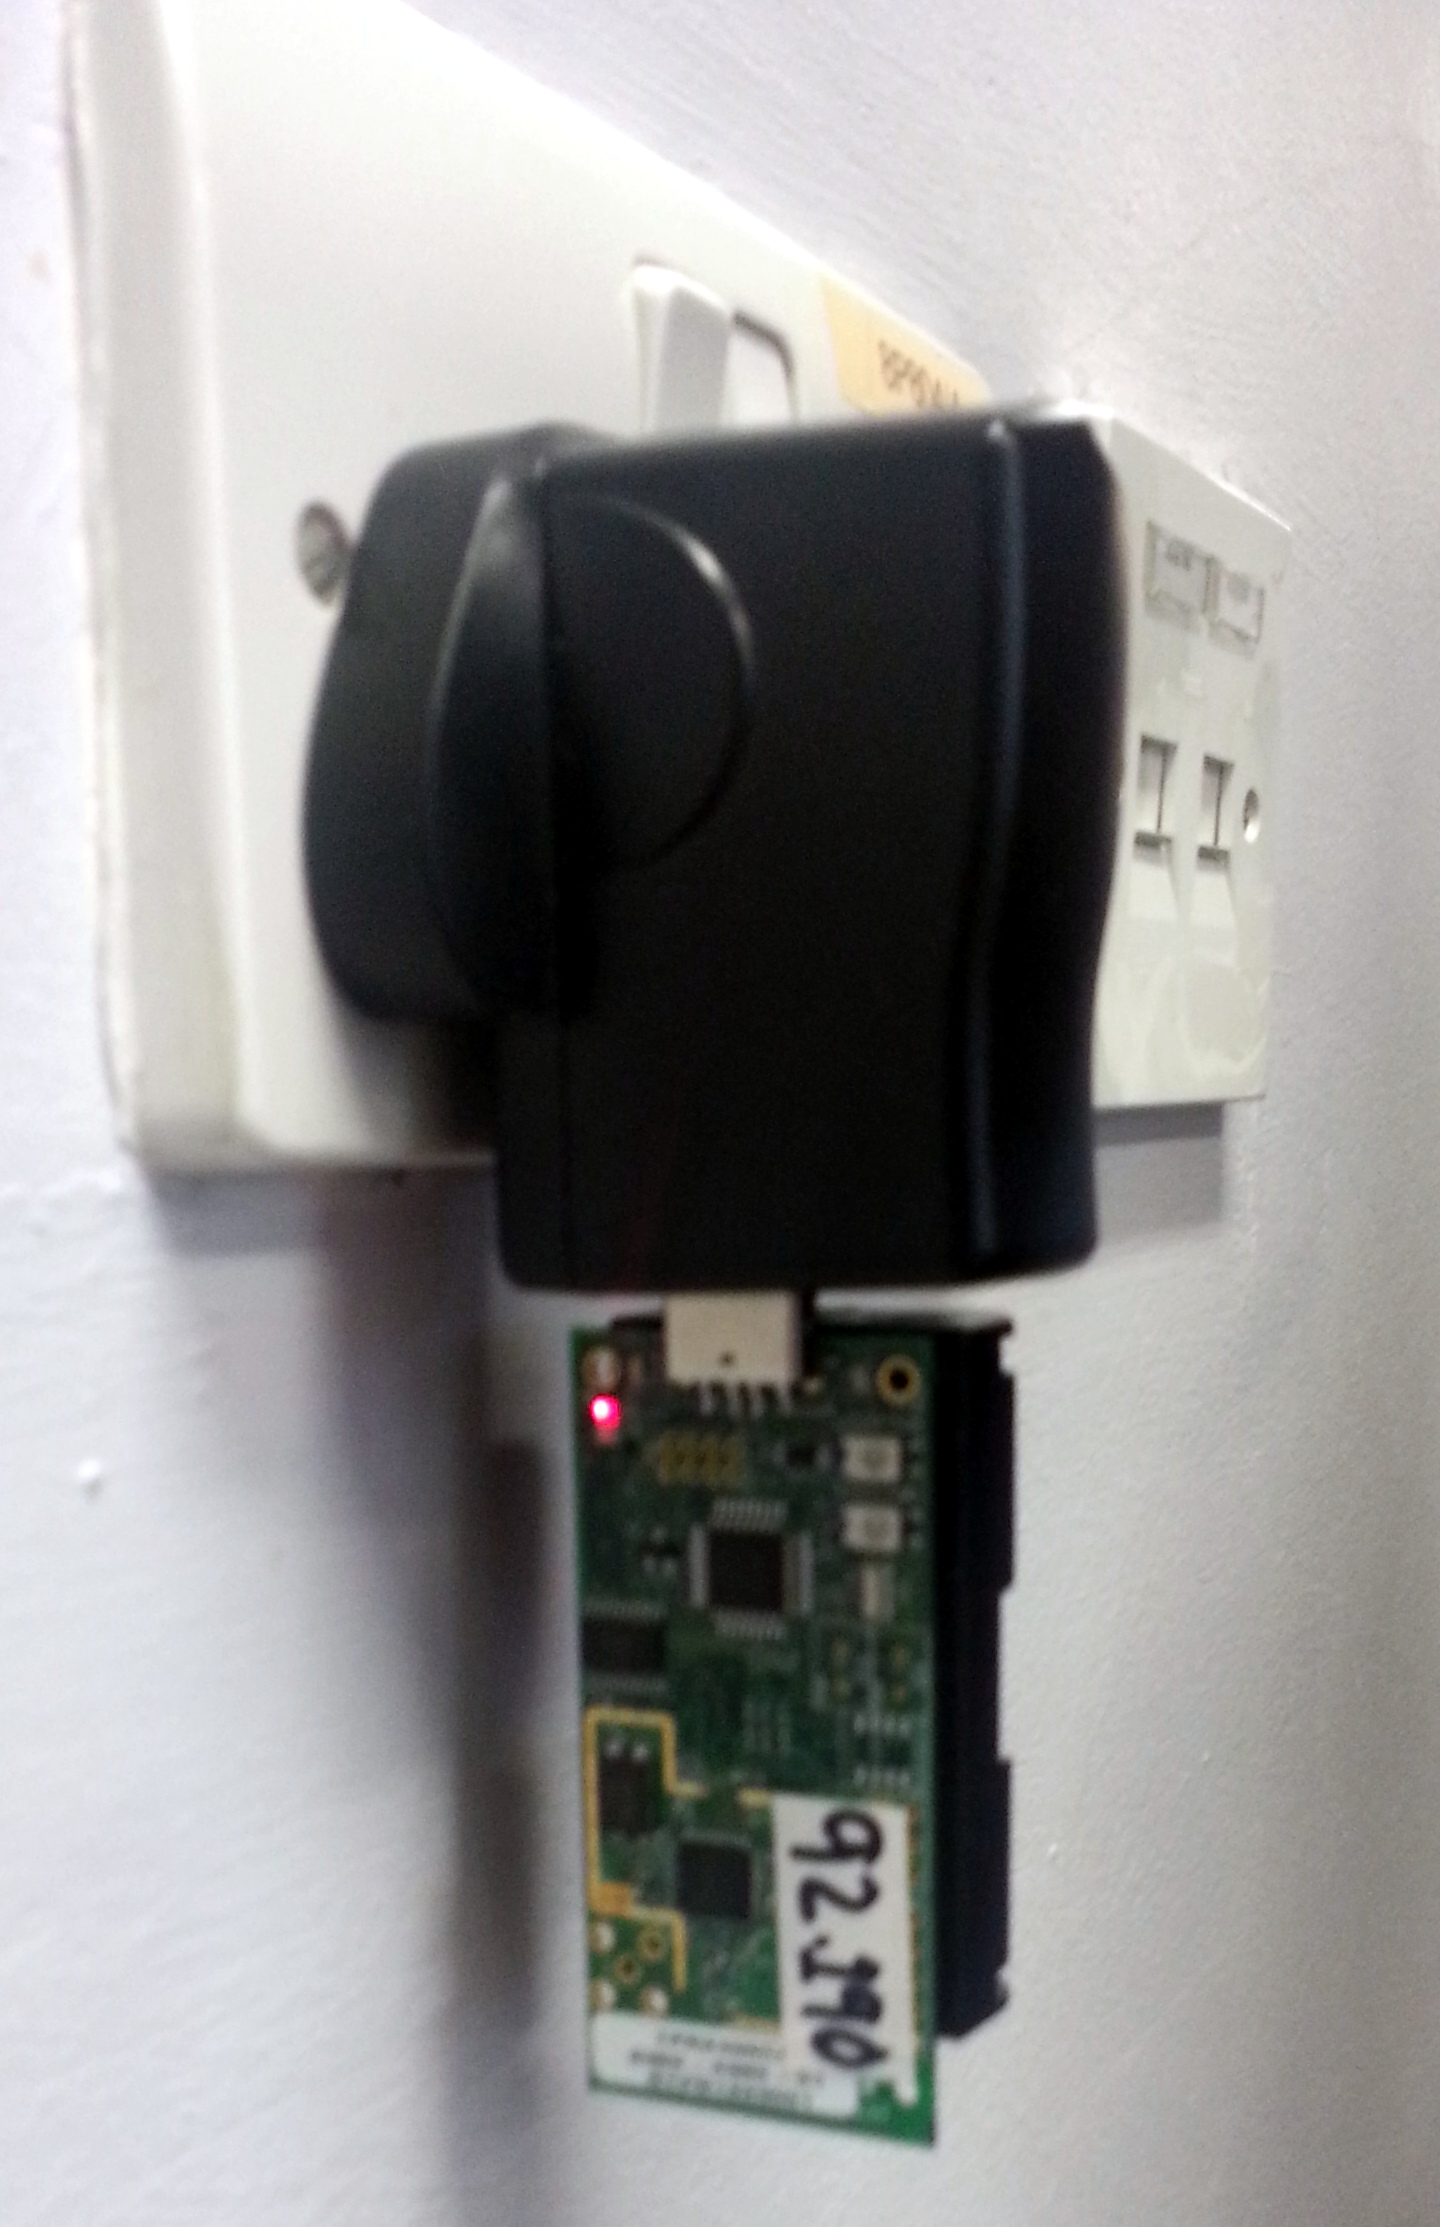
The nodes were spaced direct line of site across the office, at a distance of 5 metres. A transmitting node sent 10,000 packets out, and the receiving node counted how many were received. From these two numbers we can calculate the percentage of packets received (delivered) and those lost. Clearly we are looking for the lowest loss.
Preliminary Results
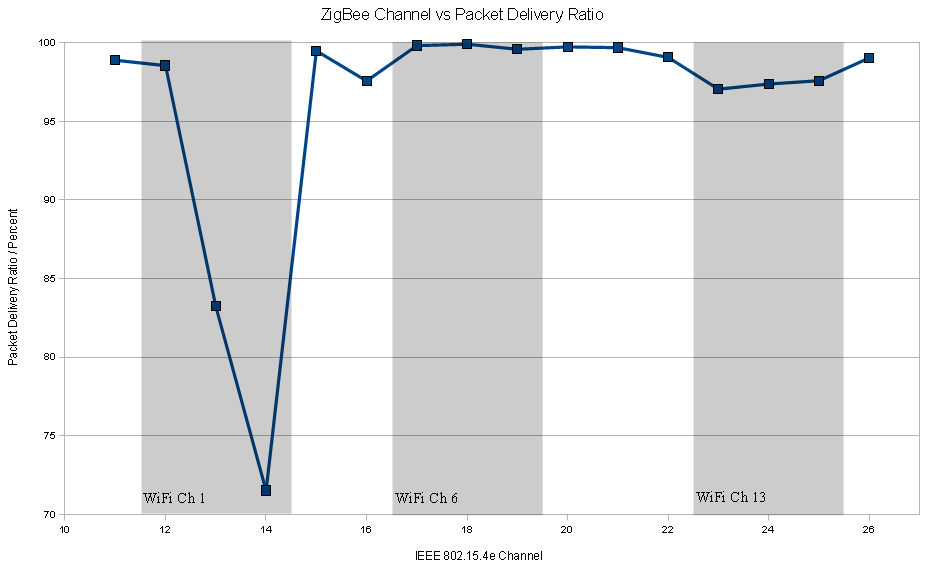
The first run was a proof of concept test. The channels were sweeped and the PDR calculated for each. The image below shows the packet delivery ratio for the IEEE 802.15.4 ZigBee channels. Overlaid are some of the key channels for IEEE 802.11 WiFi. Eduroam, the universities wireless network is on channel 1 in my part of the building which overlaps with ZigBee channels 11-14. A clear degradation in packet delivery ratio is visible where the ZigBee channels overlap with WiFi channels, especially as channel 1 is very busy.
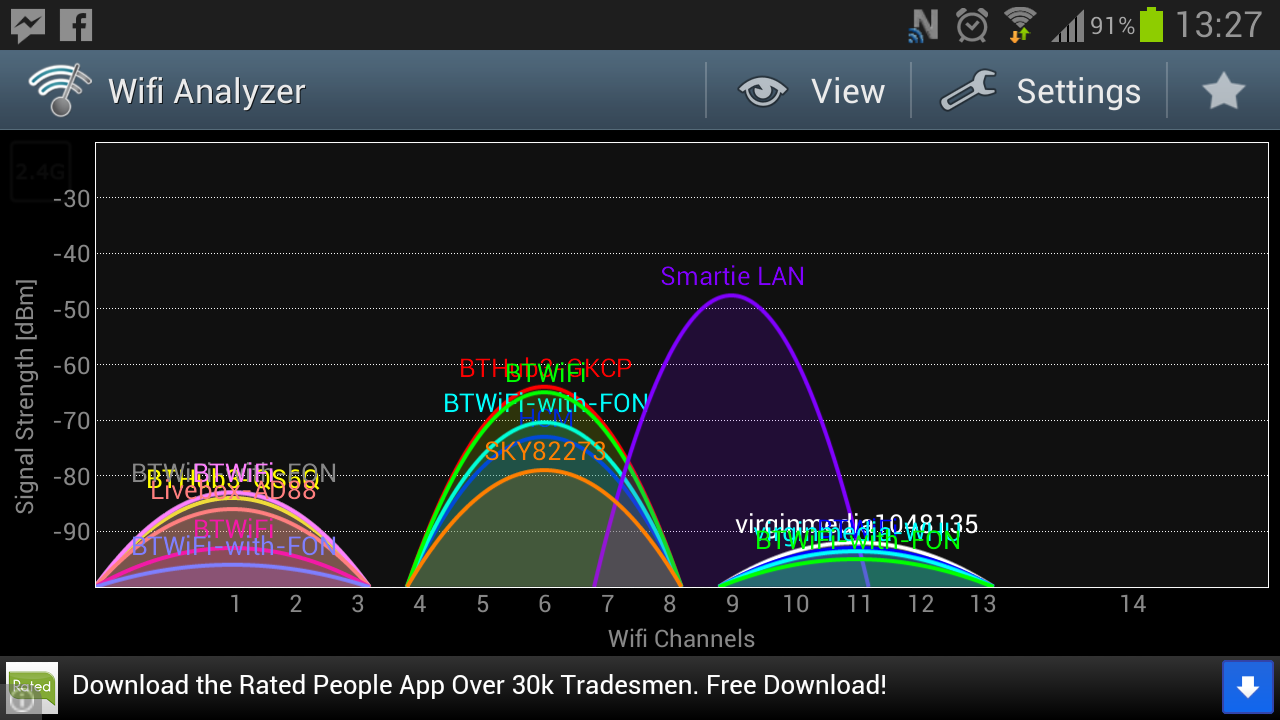
Here we see the results of WiFi Anaylser which shows which channels wireless networks are on and how strong they are.
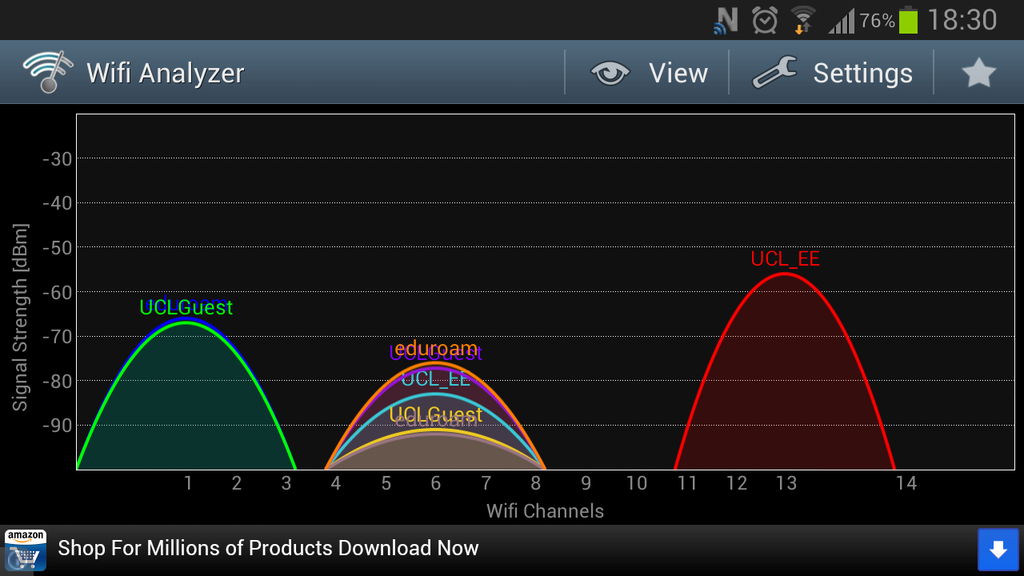
You notice from the results of WiFi Analyser that the busy networks (eduroam and UCL_Guest) are on WiFi channel 1. WiFi channel 13 has the staff (UCL_EE) network which is mildly busy. Other networks have little or no traffic and it’s only the beacons so they don’t effect the ZigBee traffic as much as is seen above.
The raw data:
| ZigBee Channel | 11 | 12 | 13 | 14 | 15 | 16 | 17 | 18 | 19 | 20 | 21 | 22 | 23 | 24 | 25 | 26 |
| PDR (%) | 98.89 | 98.55 | 83.23 | 71.51 | 99.49 | 97.57 | 99.82 | 99.91 | 99.59 | 99.74 | 99.69 | 99.07 | 97.05 | 97.38 | 97.59 | 99.04 |
Extended Results
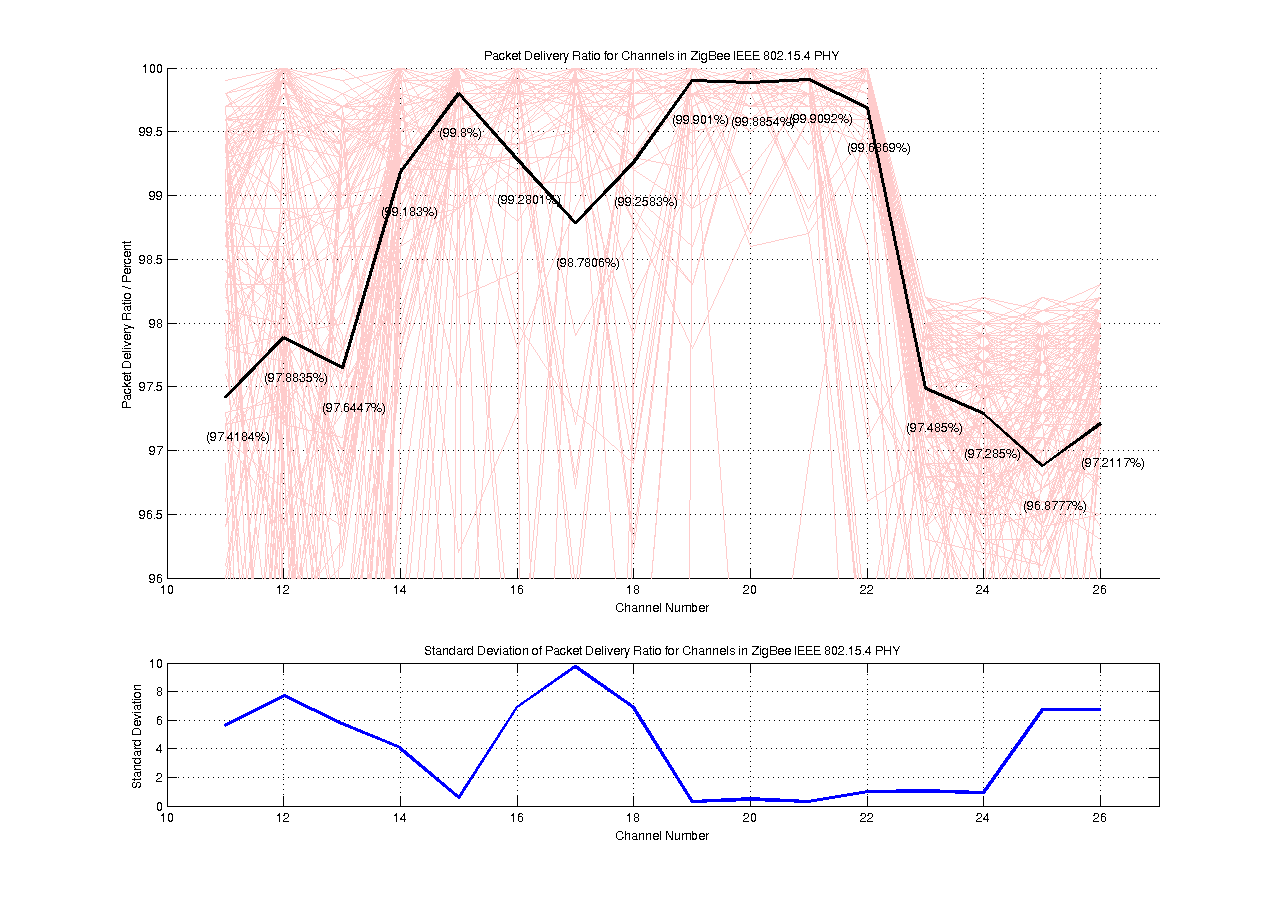
The graphs below show a much longer run over the course of a day. Here we can clearly see the effects of the 3 key WiFi channels used. The top graph comprises of 205 runs (24 hours of data) which are the red lines. The black line is the average all the runs for each channel, with PDR values in brackets. The lower graph shows the standard deviation for each channel, or how reliable the average is. Channels with a high standard deviation are unpredictable, in so much as the results are changing. Channels with a low standard deviation are channels which always experience similar losses.
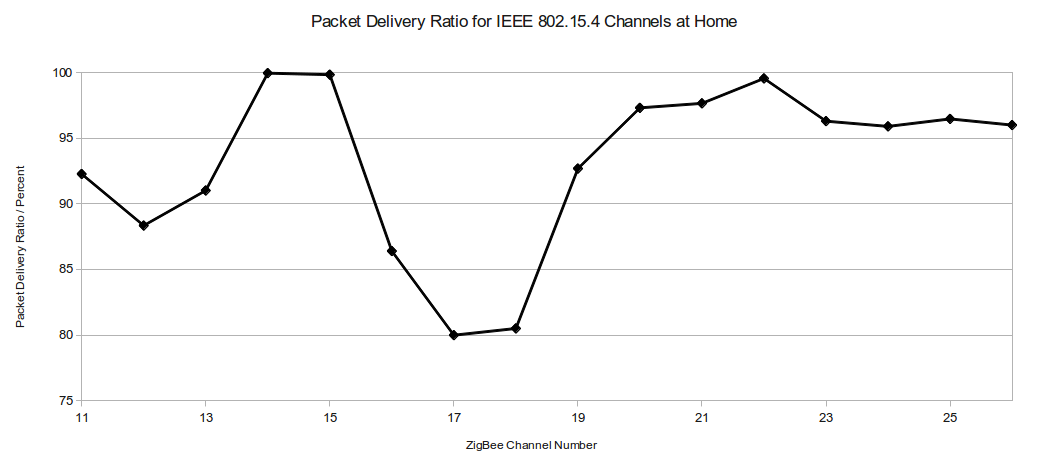
At Home
As I often work from home on these results, I decided to measure the environment at home: Again, the raw data:
| ZigBee Channel | 11 | 12 | 13 | 14 | 15 | 16 | 17 | 18 | 19 | 20 | 21 | 22 | 23 | 24 | 25 | 26 |
| PDR (%) | 92.27 | 88.34 | 91.01 | 99.96 | 99.84 | 86.40 | 79.99 | 80.50 | 92.69 | 97.31 | 97.66 | 99.56 | 96.30 | 95.90 | 96.47 | 96.00 |