Since my weather station died at home, I have not had time to repair and redesign the system to interface with the new remote Server. This page is the result of a small script that sources data from London City Airport around 8 km from my home.
I will try and get my weather station running again soon.
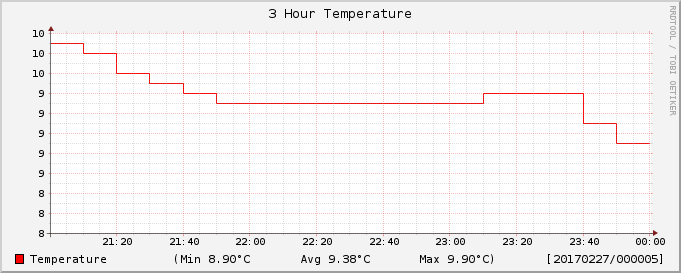
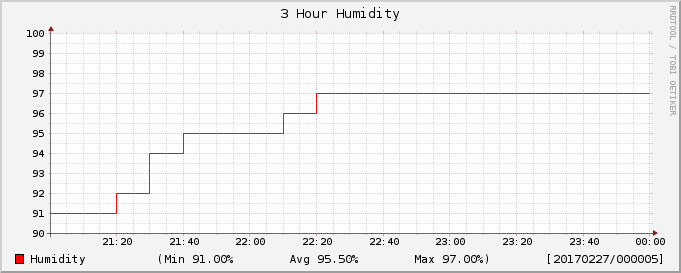
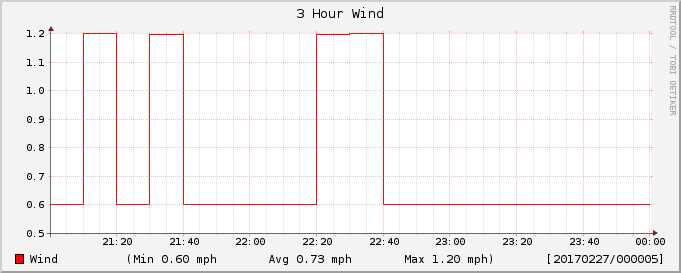
3 Hours
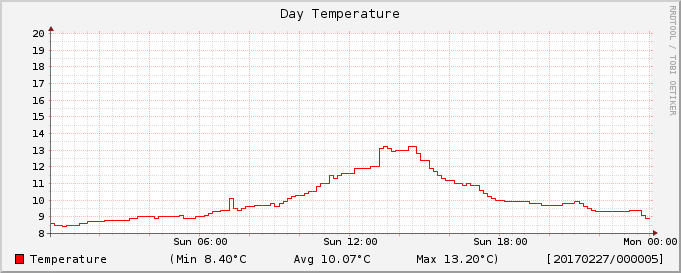
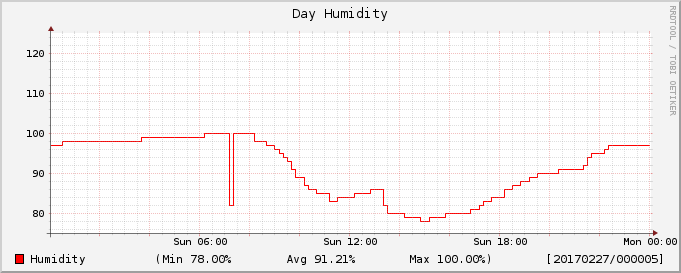
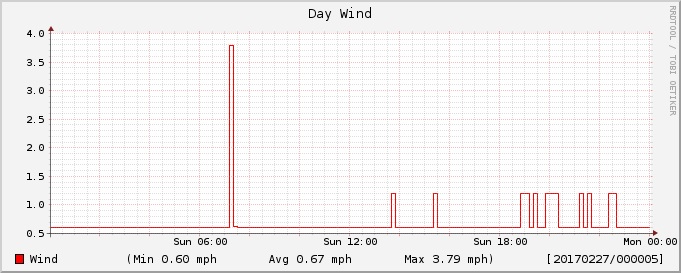
1 Day
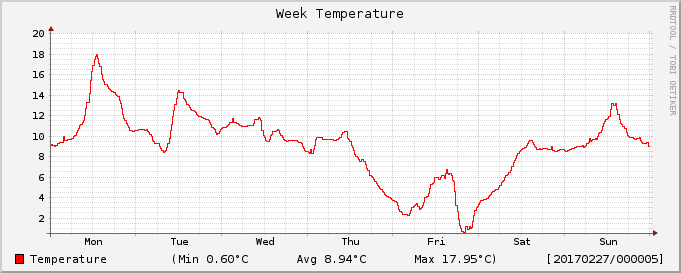
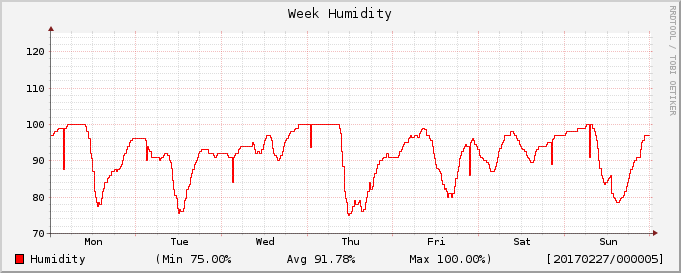
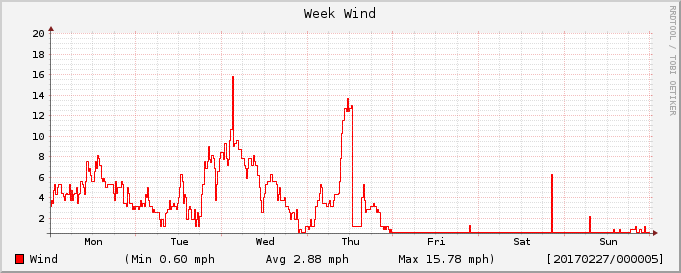
1 Week
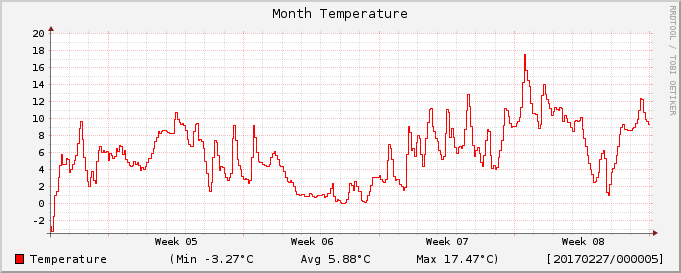
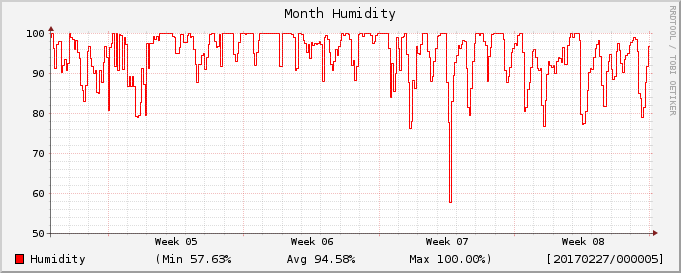
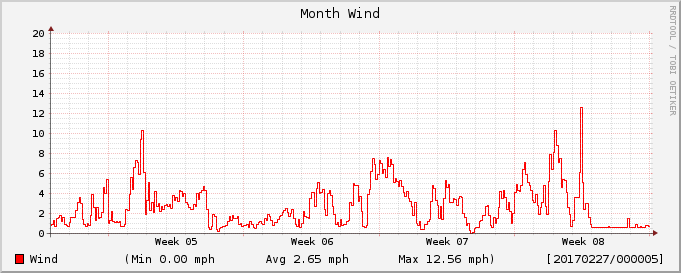
1 Month
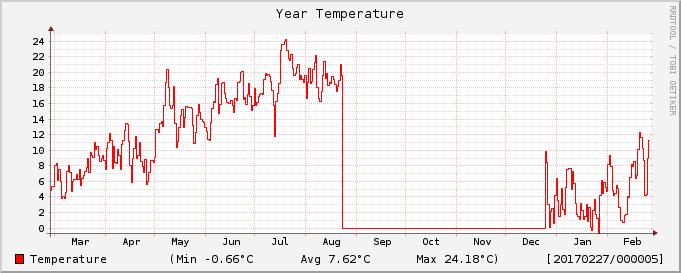
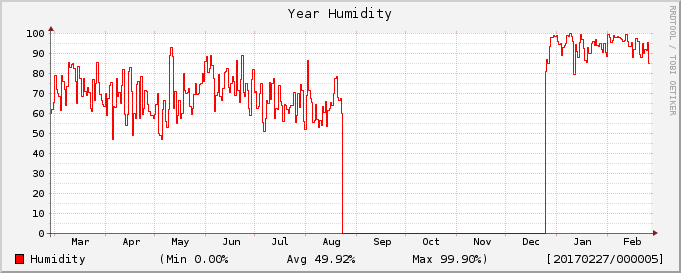
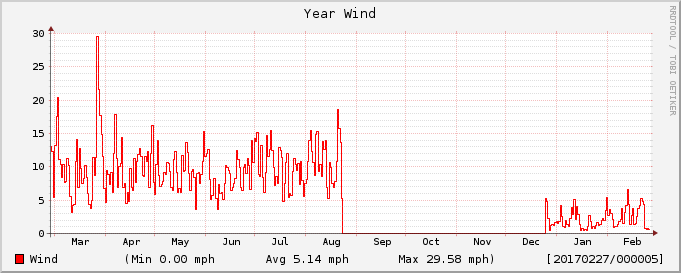
1 Year