
I recently had the chance to borrow a Red Pitaya board from Dave, G7UVW. The board is essentially 2 ARM v7 cores running at 300 MHz and an FPGA fabric.
My knowledge isn’t great enough to make this work on my own, but, fortunately the excellent work by Pavel Demin makes an 8-slice SDR receiver, records to .c2 files, and then runs wsprd to decode the recorded c2 files, uploading spots with curl to the WSPRnet website.
The process isn’t too bad to get started, so off I went.
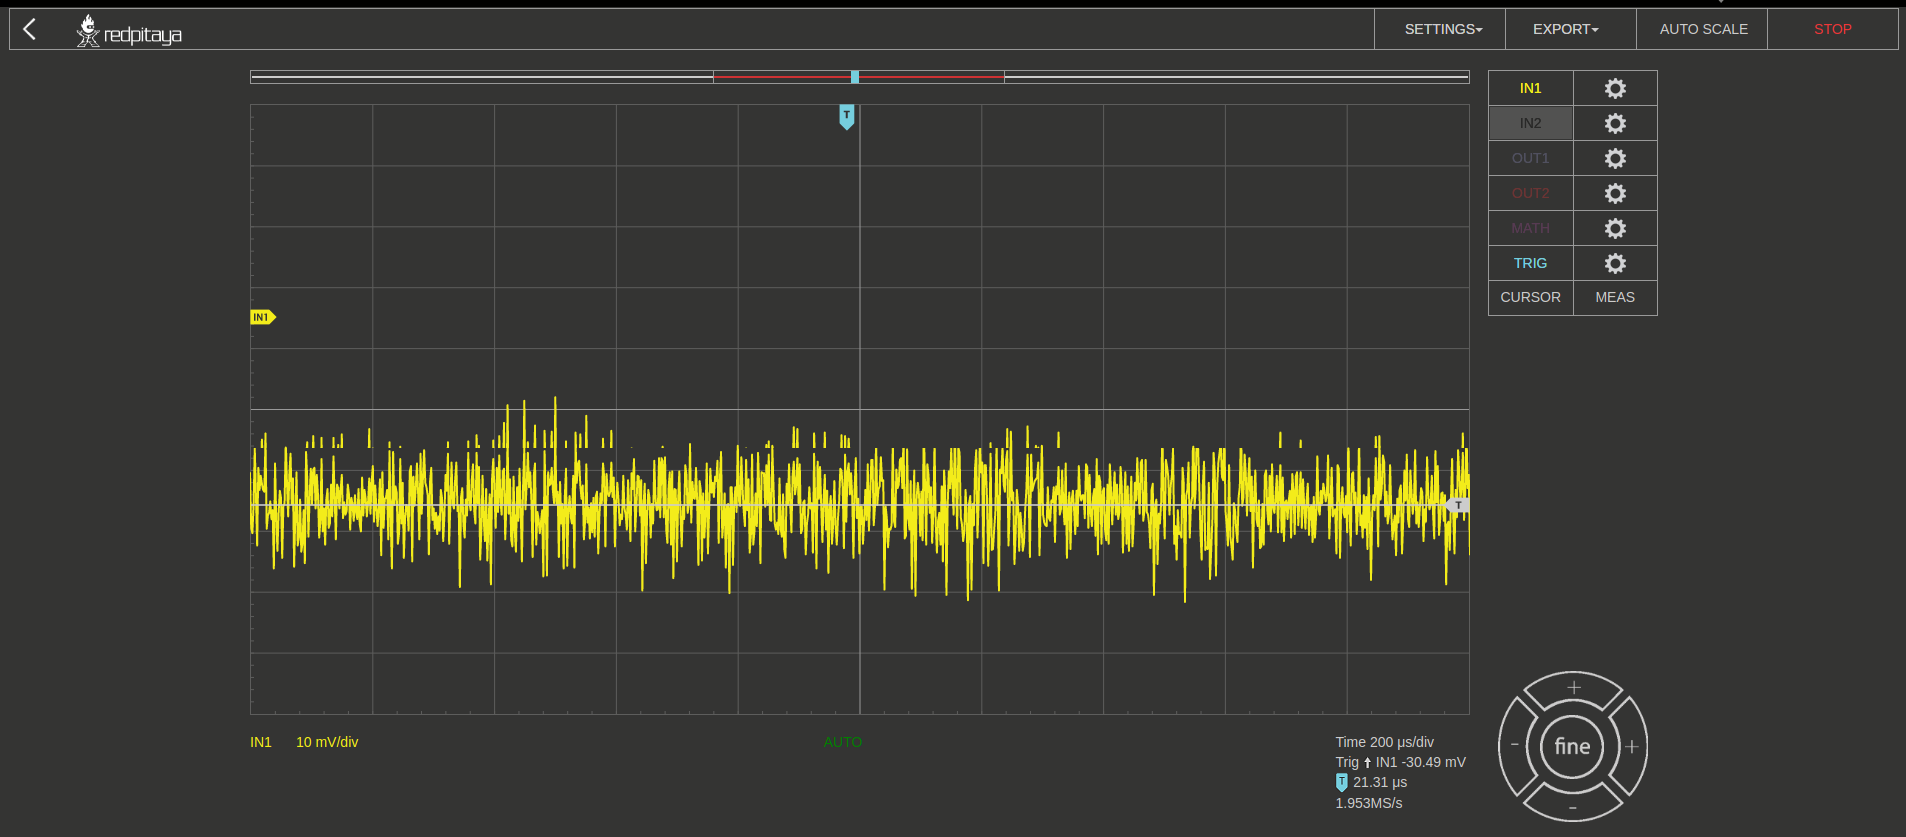
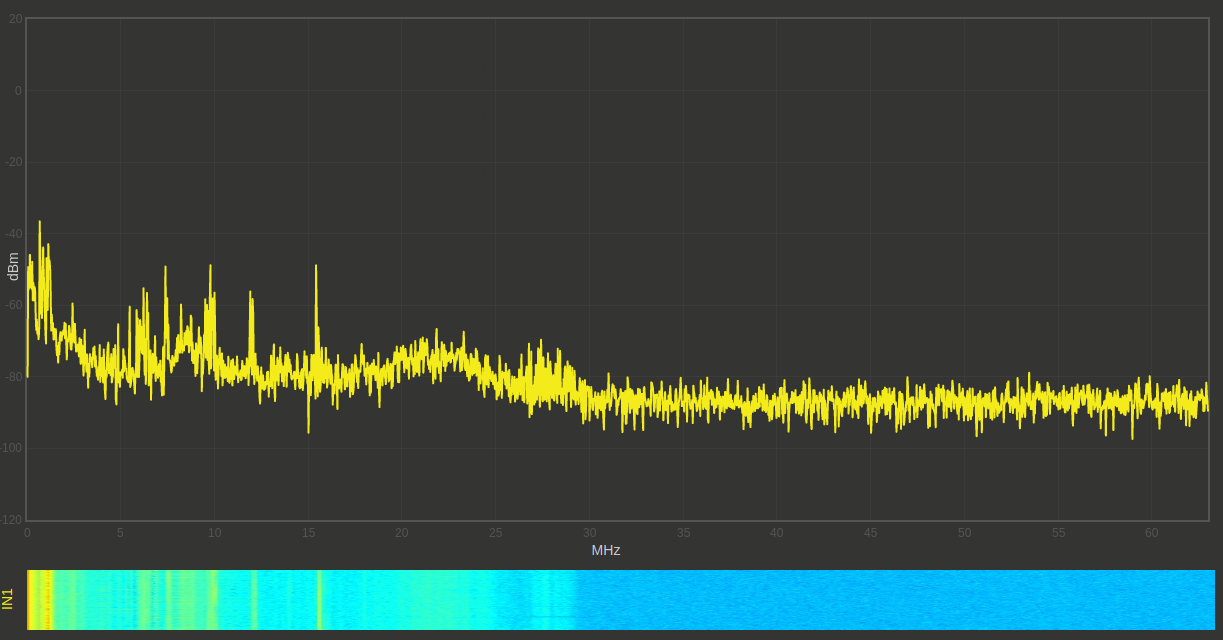
Firstly, I connected the antenna to the device. Here, it’s important to note that the input of the Red Pitaya is high impedance, since it is designed as a scope. The Red Pitaya Hardware Overview states an input impedance of 1 MΩ at 10 pF for both channels. I therefore used a 50Ω dummy load (SMA terminator) and SMA tee-piece to lower the input impedance to around 50Ω as is standard. I then connected the Loop antenna to the 50Ω assembly. Using the existing scopegenpro application on the Red Pitaya, I was able to confirm the correct connection of the antenna. The loop was receiving something…
From here, I downloaded the WSPR SDR Transceiver SD Card Image by Pavel Demin, and burned the unzipped image to an SD Card using dd:
sudo dd bs=4M status=progress if=/tmp/red-pitaya-wspr-debian-8.6-armhf-20161219.img of=/dev/sdX
Since I am on a Linux machine, the new SD card partitions were mounted following the image burn completion. From there, it’s a case of editing two files:
- /root/decode-wspr.sh
- /root/write-c2-files.cfg
In the first, /root/decode-wspr.sh, you must enter your callsign and QRA locator (in 6-digit format), as below:
# CALL and GRID should be specified to enable uploads
CALL=M1GEO
GRID=JO02OK
In the second, /root/write-c2-files.cfg, you can enter any frequency offset calculation in PPM, as well as define the bands to be used:
// frequency correction, from -100.0 ppm to +100.0 ppm
corr = -7.2;
followed by, in my case, bands 2200m to 20m:
bands = (
{ freq = 0.137500; chan = 1; },
{ freq = 0.475700; chan = 1; },
{ freq = 1.838100; chan = 1; },
{ freq = 3.594100; chan = 1; },
{ freq = 5.288700; chan = 1; },
{ freq = 7.040100; chan = 1; },
{ freq = 10.140200; chan = 1; },
{ freq = 14.097100; chan = 1; }
);
The frequency correction in PPM can be calculated using the scopegenpro application, carefully measuring a known frequency, and then calculating the error as parts-per-millon. I ended up using the JitterLabs PPM Calculator to help with this. As you see above, I arrived at an offset of -7.2 ppm. You can also use WSPR spots to compare your reported frequency to that of the average reported frequency, and calculate your offset from the average.
I saved the changes on the SD card, and, booted up the Red Pitaya with the SD card. It sprung into life immediately. After running for a while, I noticed that the spots had stopped. This turned out to be caused by an incorrect offset, and the fact that the master clock on the Red Pitaya drifted significantly with temperature. I ended up recalibrating against received WSPR spots slowly, to ensure that the temperature drift wasn’t playing much of a part. This turned out to be the issue. My first calibration value was around -56 ppm!
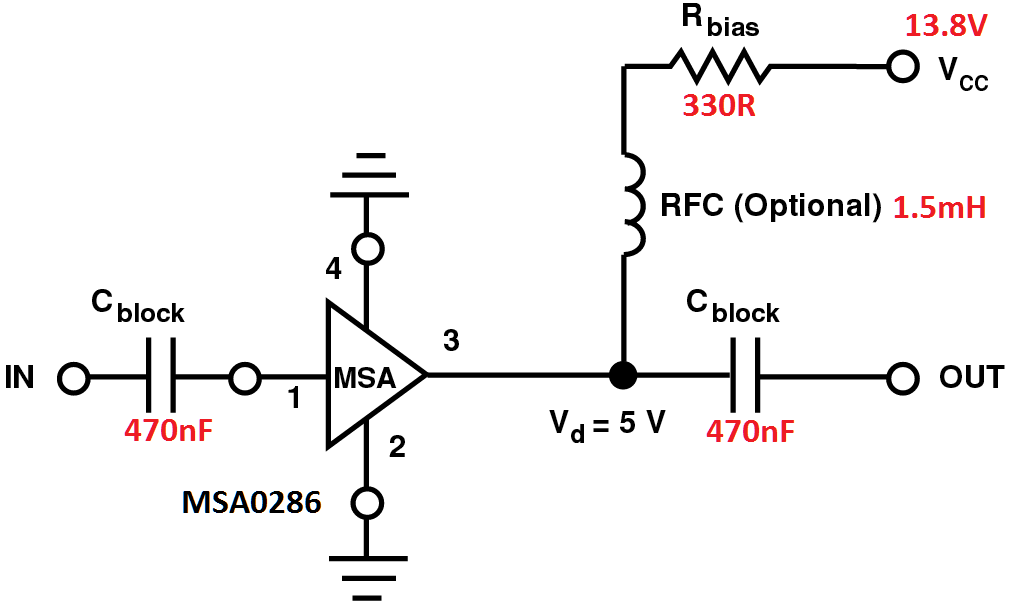
I also decided to add a bit of front end gain. Since I was using an active loop, the noise figure was already set by the loop, and so I simply used an MSA0286 wideband MMIC to add between 10-13 dB gain.
I left the decoder going overnight, and captured a lot of spots, all of which were uploaded to the WSPRnet site. An interesting aspect of many of the spotted bands can be seen:
170129 0610 3 -19 0.54 0.1374671 DC0DX JO31 10 0 1 0
170129 0610 8 -7 2.37 0.4756944 LA8AV JO59 30 0 1 0
170129 0610 6 -9 1.77 1.8380718 PA2W JO22 37 0 1 0
170129 0610 7 4 0.71 1.8381083 ON4LUC JO20 40 0 1 0
170129 0610 1 -21 1.69 3.5940149 G3JKF JO00 37 -1 1 0
170129 0610 2 -26 1.13 3.5940609 LA4YGA JO48 33 0 61 0
170129 0610 1 -30 2.67 10.1401380 G0NWB JO02 23 0 2094 -64
170129 0610 3 -23 1.05 14.0970763 M0HGU JO02 37 -2 1 0
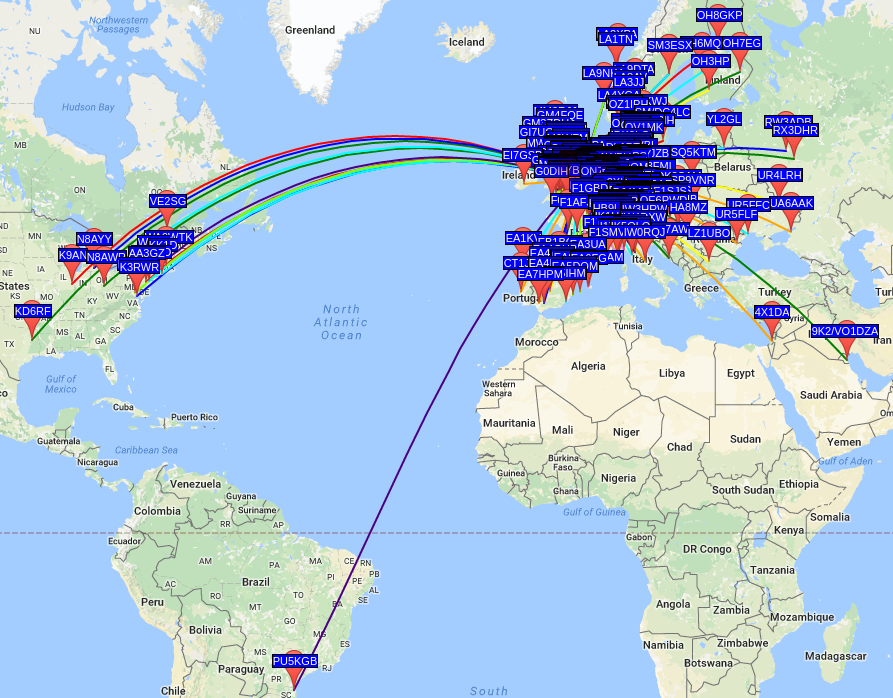
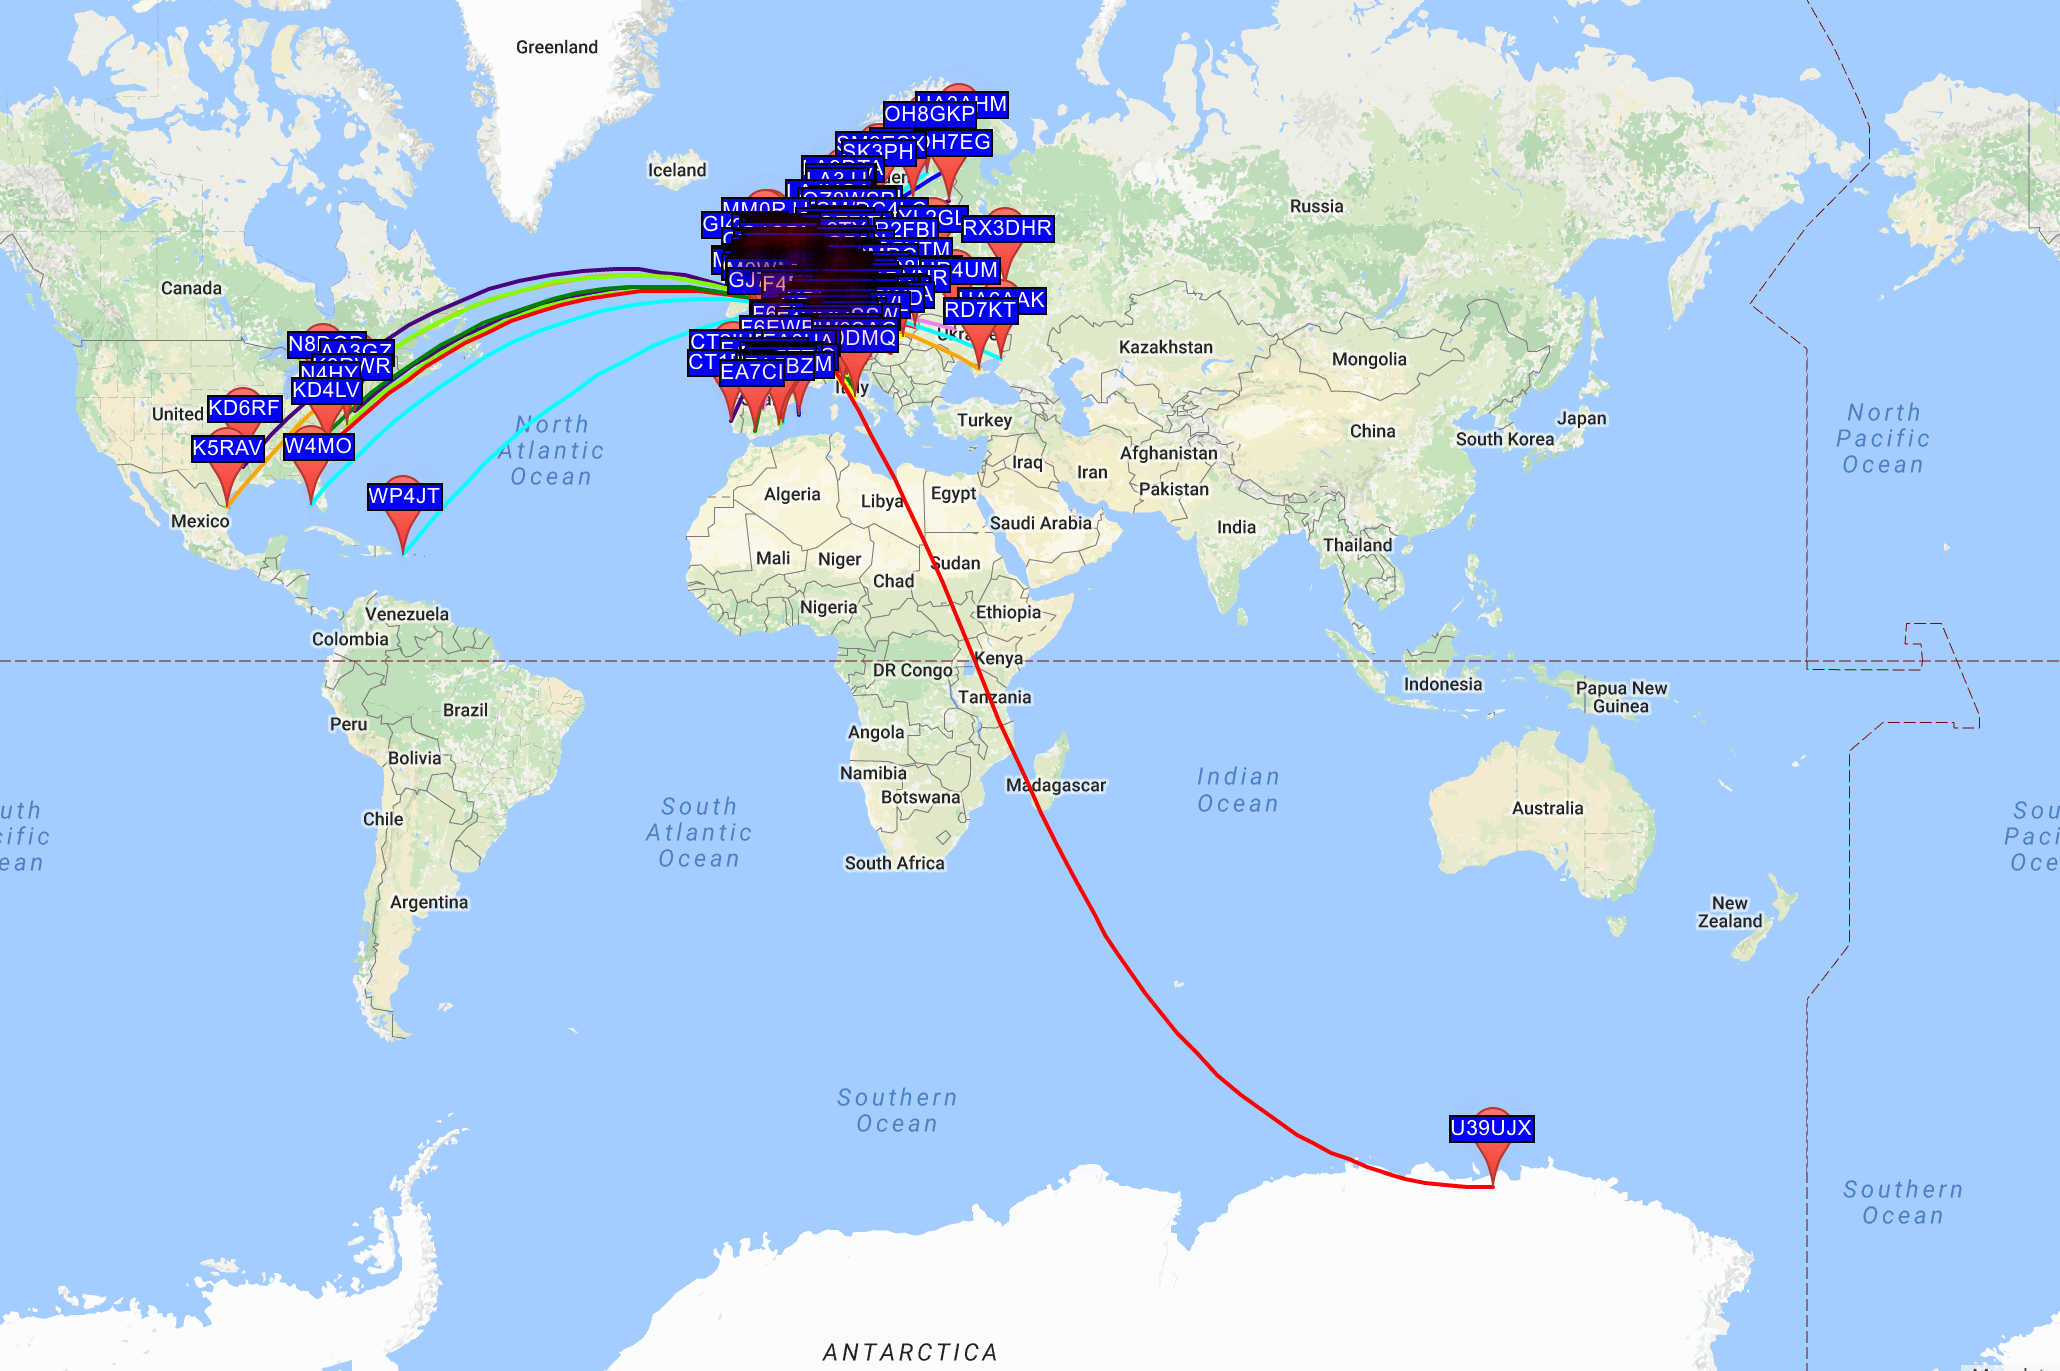
After around 20 hours of spotting, I extracted the following map:
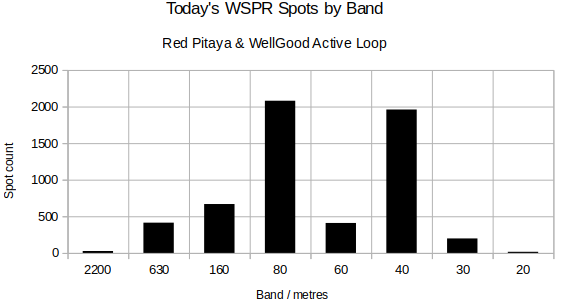
Using LibreOffice Calc, I quickly graphed the number of spots per band. I will try and do some more analysis when I have a little more time. This graph shows 5767 spots:
The following map was taken at midnight on the 31st January 2017:
More to come on this soon…